You signed in with another tab or window. Reload to refresh your session.You signed out in another tab or window. Reload to refresh your session.You switched accounts on another tab or window. Reload to refresh your session.Dismiss alert
As part of #148, we should decide on what benchmarking tool we want to use. Currently we're just having pytest print out test run times, but it was always intended for us to switch to using a more proper benchmarking framework at some point. asv is the primary (only?) benchmarking tool I'm aware of that's used in our space (e.g. NumPy, pandas, scikit-image, Xarray all use asv to monitor performance). Because of this I'm inclined to default to using asv unless there is a compelling reason not to do so.
Are folks aware of other benchmarking tools we should consider?
Airspeed velocity is a benchmarking tool that provides a set of tools for tracking speed and finding performance regressions. It's widely used (lots of pydata projects, also rich). Notably, ibis recently moved away from asv to pytest-benchmark, for some of the same reasons as listed below. Until recently, it was quasi-abandoned, but a numfocus grant to pandas has provided some maintenance resources.
Features
A CLI for running and inspecting results
A static site for visualizing said results, easily hosted on GitHub Pages
A JSON database format for storing results
Drawbacks
It wants to know a lot of information about the machine on which the benchmark is run. Since the bulk of our computation is remote on well-specified instances, this isn't really relevant for our benchmarks. It's an annoyance, but we could probably find a workaround.
It wants to manage your software environment. Again, we don't really need this since we manage our own environment.
It doesn't use pytest, instead it has its own setup and teardown functionality, analogous to fixtures, but different. We'd probably need to refactor.
pytest-benchmark is a pytest plugin that provides some similar functionality to asv. It is used by some projects, including ibis and RAPIDs. It includes a fixture that one can include in regular pytest tests which produces benchmarking statistics, and allows for JSON export.
Features
Easy interoperability with existing pytest tests and fixtures
JSON database format for storing results
Some CLI and local charting tooling
Drawbacks
No built-in static site. This is really significant! The rapids team has developed a bridge tool to produce asv JSON from pytest-benchmark results, presumably for this reason: https://github.com/rapidsai/asvdb
Conbench is a multi-language benchmarking tool developed by the arrow team. It includes a schema for benchmark outputs and a server for displaying them on a website. In many ways, it looks like the most featureful option out there.
Features
A schema for cross-language benchmarking results
A postgres+flask server with a dashboard for reporting results
Tooling for running cross-language benchmarks
Drawbacks
Perhaps too heavy for what we want right now. I'd rather maintain a static site on GH-pages than a whole server
Provides features we likely don't need (we can stick with python-native stuff)
The rapids team has developed a bridge tool to produce asv JSON from pytest-benchmark results
If this is something we could easily drop in and use, then naively to me that makes it sound like pytest-benchmark for running tests + asv for plotting them seems ideal? Given that we've already invested in pytest infrastructure for our cluster fixtures, and for dealing with software environments. The ability to just have to use one tool (pytest) that everyone already knows for both integration tests + benchmarks is appealing.
But I haven't looked at asvdb at all, so I'm probably not understanding the complexity of translating the formats.
If this is something we could easily drop in and use, then naively to me that makes it sound like pytest-benchmark for running tests + asv for plotting them seems ideal?
It certainly might be a good fit -- I haven't really evaluated yet how easy asvdb is to use, and how well-supported it is.
@fjetter -- Thanks for adding this additional set of requirements.
Suggest we make certain we retain the flexibility to add the your referenced (and others if needed) metrics in future iterations, but limit the scope of this initial work to execution time. Thoughts?
I think memory usage needs to be a core requirement. It's often more important than runtime. A change that caused an existing workload to use more memory than before would be a serious regression. A workload that uses less would be a big deal to market and evangelize.
I'd honestly love to have the CSV output of a MemorySampler for every run, and build a simple little Vega-lite app to be able to overlay memory profiles between different runs. But tracking peak memory (which we'd do with a MemorySampler anyway) just like we track runtime should be part of our benchmarking dashboards.
Yes, I agree we can start with a minimal set of features. I also agree with Gabe that memory might be more important than runtime so we should follow up with "custom metrics" asap. However, there is often a strong correlation so for the very first iteration I'd be fine with either to get us started and would prefer us getting up the basic infrastructure asap. I do consider it a core requirement but that doesn't mean it needs to be delivered in the first iteration.
I agree that it's a core requirement, and should be done very quickly after an initial infrastructure setup. I wrote up #192 in order to discuss custom metrics a bit more. As far as tooling goes, I think it's important for whatever we go with to be sufficiently flexible to add whatever metrics we want down the line.
I'd honestly love to have the CSV output of a MemorySampler for every run, and build a simple little Vega-lite app to be able to overlay memory profiles between different runs. But tracking peak memory (which we'd do with a MemorySampler anyway) just like we track runtime should be part of our benchmarking dashboards.
An update here based on some conversations that @ncclementi and I have had this week:
There are a number of requirements that we have (some listed in #148), but I'm repeating them here:
The ability to record historical data
The ability to compare two commits or two different configurations (e.g. to verify feature toggles or test PRs)
The ability to test PRs or commits on dask/dask and dask/distributed
The ability to collect multiple metrics in the same run (e.g., runtime, peak memory, group compute time, etc)
The ability to store various artifacts produced during the run (e.g. performance report or MemorySampler output)
The ability to automatically identify regressions in scheduled benchmarking sessions
In addition to these, there are a few nice-to-haves:
pytest-compatibility (i.e., can we use the tool with fixtures, parametrizations, etc?)
Built-in static site for visualizing longitudinal results
I put together a small visualization on how some of the options stack up on a lot of these metrics:
None of the options hit all of the features we want. In particular, I think that there are some major (fatal?) drawbacks for all of the off-the-shelf tools. pytest-benchmark doesn't allow for implementing custom metrics, nor does it allow us to collect multiple metrics in the same test/benchmark. It's also missing a built-in static site. Airspeed velocity does allow for custom metrics, but it doesn't have an easy way to collect multiple things in the same test/benchmark. It does have a static site, but it is not pytest-compatible. The rapids-style merging of the above two options doesn't really solve their drawbacks, either.
@ncclementi and I are therefore coming around on the idea of building our own benchmarking tool. The existing fixtures that we have developed already to some of what we want, and adding things like tracking timing data and memory usage shouldn't be an enormous lift (and custom metrics like memory would have to be implemented with any tooling). The things we would need to build in this scenario are:
A small static site (this isn't as hard as it might once have been -- python dashboarding tools like panel or dash have come a long way)
A way to easily compare refs or different configurations
A way to record historical data (I have a POC using sqlite)
A way to identify regressions
@mrocklin points out that some of these things can be built into coiled itself. We already collect cluster metrics (including some of the ones we care about) and visualize them in the "Analytics" page. It would also neatly solve the problem of how to record historical data (put it in the platform!). On the other hand, there are things it doesn't do right now that we would still need to build, including how to track and visualize named jobs (benchmarks) across many runs. There is a path where we accidentally design/build an airflow or prefect. My current instinct is to make something lightweight here, then see whether we can move it into coiled.
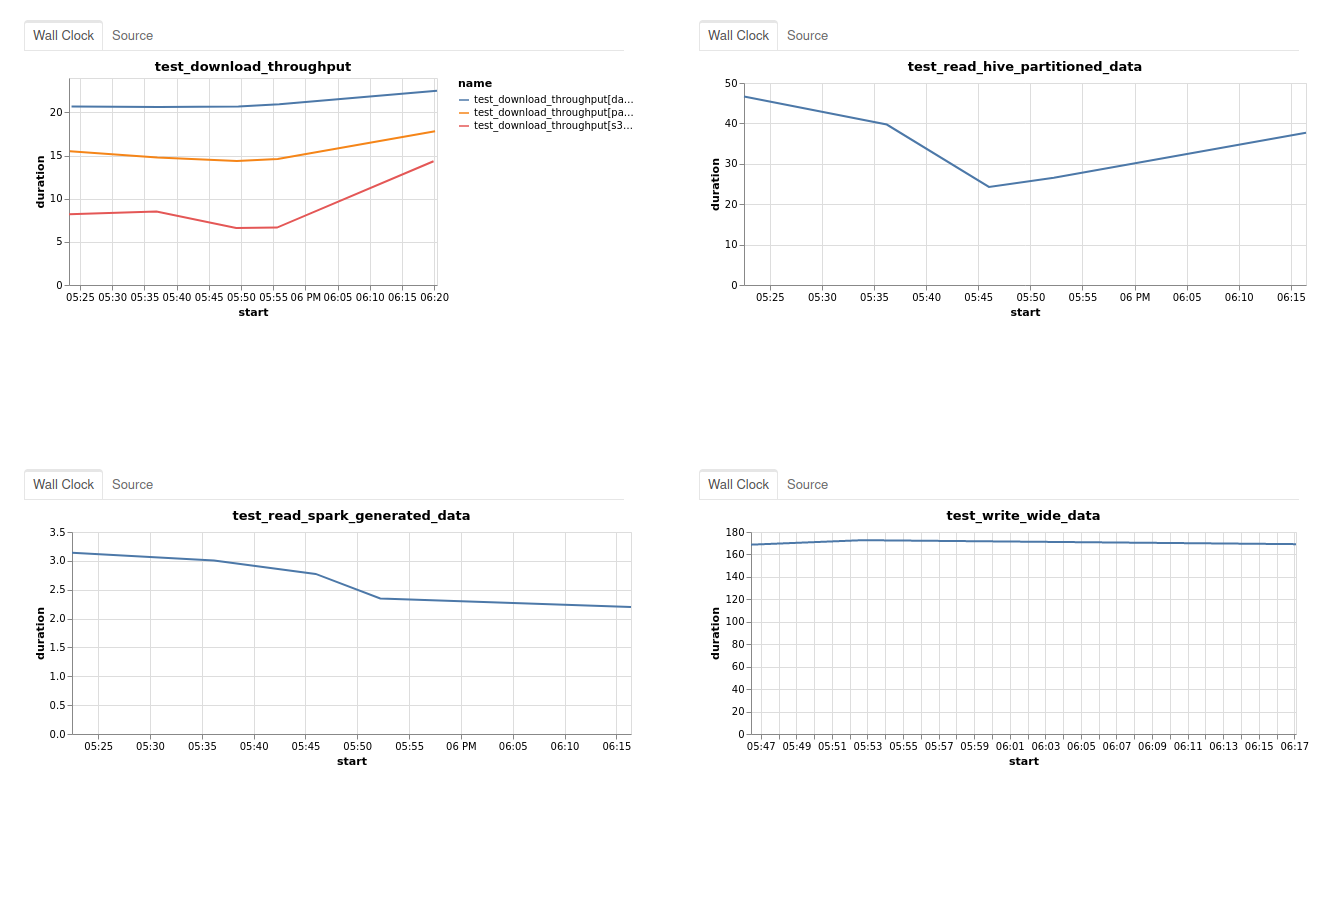
As a taste of the type of thing I'm describing above under "custom fixtures", here is a screenshot of some of the parquet benchmarks visualized using fixtures+sqlite+panel:
@ian-r-rose a few days ago you showed me an initial pass at what the custom fixture approach might look like. I was pleasantly surprised by how straightforward the code needed for that approach was. Could you open up a PR with that so others can more easily take a look?
Activity
[-]Benchmarking tool[/-][+]Choose benchmarking tool[/+]ian-r-rose commentedon Jun 22, 2022
Airspeed Velocity (asv)
Airspeed velocity is a benchmarking tool that provides a set of tools for tracking speed and finding performance regressions. It's widely used (lots of pydata projects, also rich). Notably,
ibisrecently moved away from asv to pytest-benchmark, for some of the same reasons as listed below. Until recently, it was quasi-abandoned, but a numfocus grant to pandas has provided some maintenance resources.Features
Drawbacks
ian-r-rose commentedon Jun 22, 2022
pytest-benchmark
pytest-benchmarkis a pytest plugin that provides some similar functionality to asv. It is used by some projects, including ibis and RAPIDs. It includes a fixture that one can include in regular pytest tests which produces benchmarking statistics, and allows for JSON export.Features
Drawbacks
ian-r-rose commentedon Jun 22, 2022
Conbench
Conbench is a multi-language benchmarking tool developed by the arrow team. It includes a schema for benchmark outputs and a server for displaying them on a website. In many ways, it looks like the most featureful option out there.
Features
Drawbacks
gjoseph92 commentedon Jun 22, 2022
If this is something we could easily drop in and use, then naively to me that makes it sound like
pytest-benchmarkfor running tests + asv for plotting them seems ideal? Given that we've already invested in pytest infrastructure for our cluster fixtures, and for dealing with software environments. The ability to just have to use one tool (pytest) that everyone already knows for both integration tests + benchmarks is appealing.But I haven't looked at asvdb at all, so I'm probably not understanding the complexity of translating the formats.
ian-r-rose commentedon Jun 22, 2022
It certainly might be a good fit -- I haven't really evaluated yet how easy
asvdbis to use, and how well-supported it is.fjetter commentedon Jun 24, 2022
I would like to point out that our requirements are a bit more than just time measurement, see #148 (comment)
The list there is probably not exhaustive and I would invite everyone to think about what we need for this to become a good experience.
hayesgb commentedon Jun 24, 2022
@fjetter -- Thanks for adding this additional set of requirements.
Suggest we make certain we retain the flexibility to add the your referenced (and others if needed) metrics in future iterations, but limit the scope of this initial work to execution time. Thoughts?
gjoseph92 commentedon Jun 25, 2022
I think memory usage needs to be a core requirement. It's often more important than runtime. A change that caused an existing workload to use more memory than before would be a serious regression. A workload that uses less would be a big deal to market and evangelize.
I'd honestly love to have the CSV output of a
MemorySamplerfor every run, and build a simple little Vega-lite app to be able to overlay memory profiles between different runs. But tracking peak memory (which we'd do with aMemorySampleranyway) just like we track runtime should be part of our benchmarking dashboards.fjetter commentedon Jun 27, 2022
Yes, I agree we can start with a minimal set of features. I also agree with Gabe that memory might be more important than runtime so we should follow up with "custom metrics" asap. However, there is often a strong correlation so for the very first iteration I'd be fine with either to get us started and would prefer us getting up the basic infrastructure asap. I do consider it a core requirement but that doesn't mean it needs to be delivered in the first iteration.
ian-r-rose commentedon Jun 27, 2022
I agree that it's a core requirement, and should be done very quickly after an initial infrastructure setup. I wrote up #192 in order to discuss custom metrics a bit more. As far as tooling goes, I think it's important for whatever we go with to be sufficiently flexible to add whatever metrics we want down the line.
I see you trying to nerd-snipe me here...
ian-r-rose commentedon Jul 7, 2022
An update here based on some conversations that @ncclementi and I have had this week:
There are a number of requirements that we have (some listed in #148), but I'm repeating them here:
In addition to these, there are a few nice-to-haves:
I put together a small visualization on how some of the options stack up on a lot of these metrics:
None of the options hit all of the features we want. In particular, I think that there are some major (fatal?) drawbacks for all of the off-the-shelf tools.
pytest-benchmarkdoesn't allow for implementing custom metrics, nor does it allow us to collect multiple metrics in the same test/benchmark. It's also missing a built-in static site. Airspeed velocity does allow for custom metrics, but it doesn't have an easy way to collect multiple things in the same test/benchmark. It does have a static site, but it is not pytest-compatible. The rapids-style merging of the above two options doesn't really solve their drawbacks, either.@ncclementi and I are therefore coming around on the idea of building our own benchmarking tool. The existing fixtures that we have developed already to some of what we want, and adding things like tracking timing data and memory usage shouldn't be an enormous lift (and custom metrics like memory would have to be implemented with any tooling). The things we would need to build in this scenario are:
@mrocklin points out that some of these things can be built into coiled itself. We already collect cluster metrics (including some of the ones we care about) and visualize them in the "Analytics" page. It would also neatly solve the problem of how to record historical data (put it in the platform!). On the other hand, there are things it doesn't do right now that we would still need to build, including how to track and visualize named jobs (benchmarks) across many runs. There is a path where we accidentally design/build an airflow or prefect. My current instinct is to make something lightweight here, then see whether we can move it into coiled.
ian-r-rose commentedon Jul 7, 2022
As a taste of the type of thing I'm describing above under "custom fixtures", here is a screenshot of some of the parquet benchmarks visualized using fixtures+sqlite+panel:

jrbourbeau commentedon Jul 12, 2022
@ian-r-rose a few days ago you showed me an initial pass at what the custom fixture approach might look like. I was pleasantly surprised by how straightforward the code needed for that approach was. Could you open up a PR with that so others can more easily take a look?
ncclementi commentedon Jul 20, 2022
Should we close this one, as the tool has been chosen, Or do we want to wait for the merge?
See #208
ian-r-rose commentedon Jul 20, 2022
I'm happy to close this, I think the research here is done. Thanks for the reminder @ncclementi