Repository navigation
how to use fillbetween? #21
Description

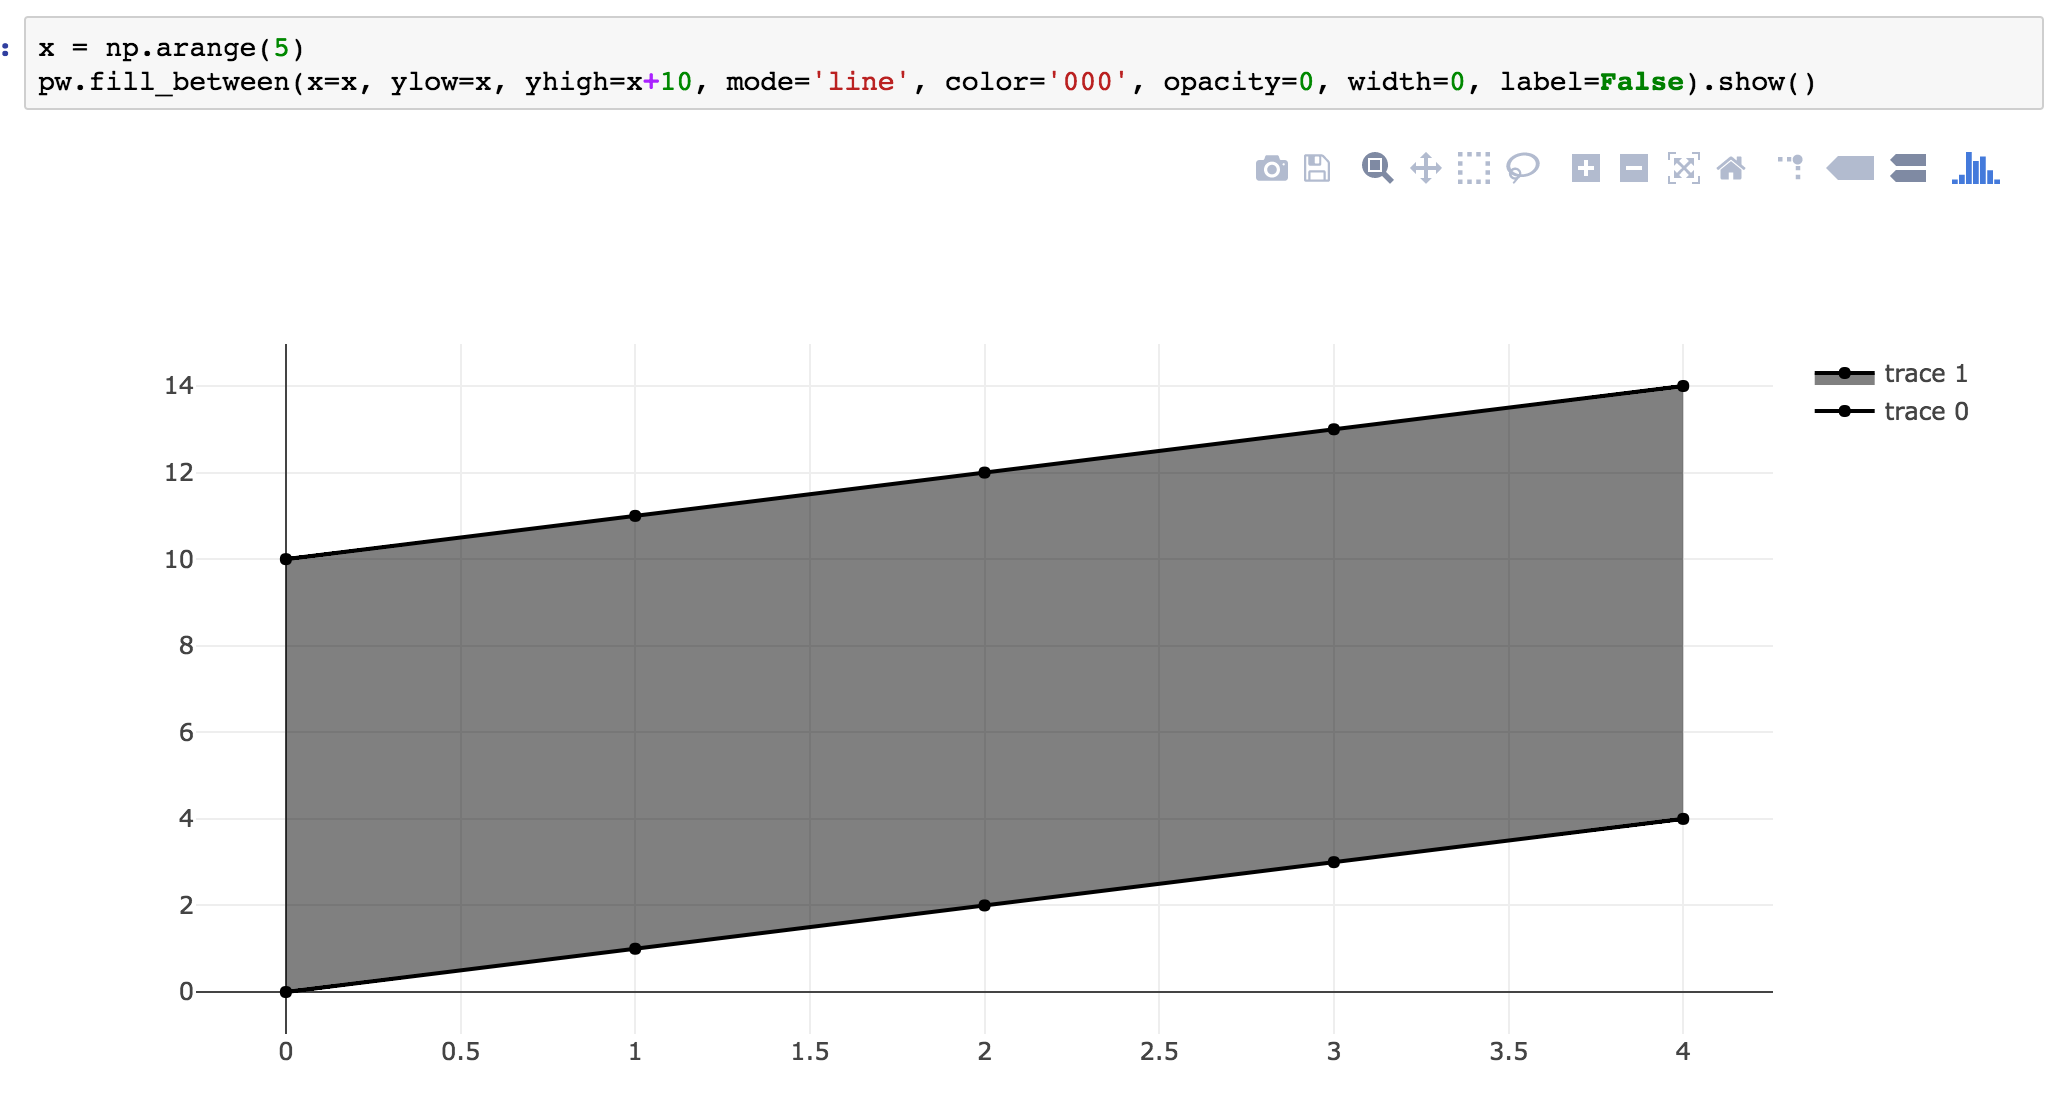
yo, im trying to get pw.fill_between to plot a translucent shaded area with no lines and no label, but i can't seem to massage it correctly...
x = np.arange(5)
pw.fill_between(x=x, ylow=x, yhigh=x+10, mode='line', color='000', opacity=0.5, width=0, label=False).show()
actually the opacity doesn't do anything for me, nor does the width, nor the label.
any clue?
Activity
jwkvam commentedon Nov 1, 2017
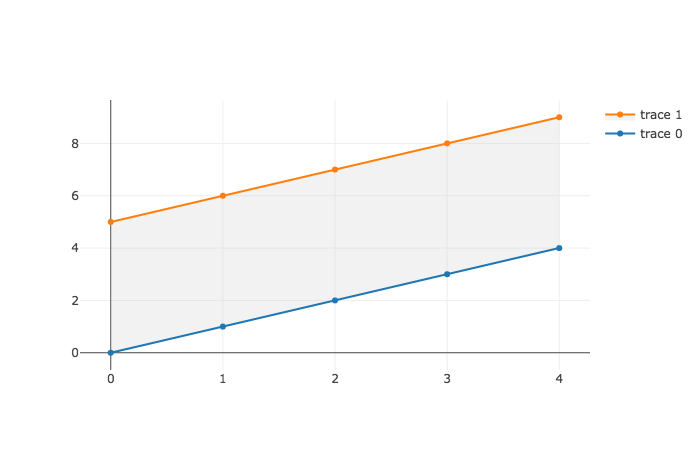
Thanks for letting me know about those issues. I'm not sure what's going on yet. In the meantime you can use this snippet to adjust the opacity of the fill.
The fill color is #RGBA format.
dswah commentedon Nov 1, 2017
ok. i'll keep that in mind.