Hello,
I've recently started working on a plugin for open-ephys and I noticed a strange behaviour with signals that have a low sampling rate (around 100Hz), specifically there are discontinuities in the waveform.
The behaviour can be reproduced with the File Reader by loading this sample data which contains 472 samples and 4 channels, each sample has a constant value (0.97uV for channel 1, approx. 2 uV for channel 2 and so on). The expectation is to see a continuous line in the LFP plot, but it's often an interrupted line.
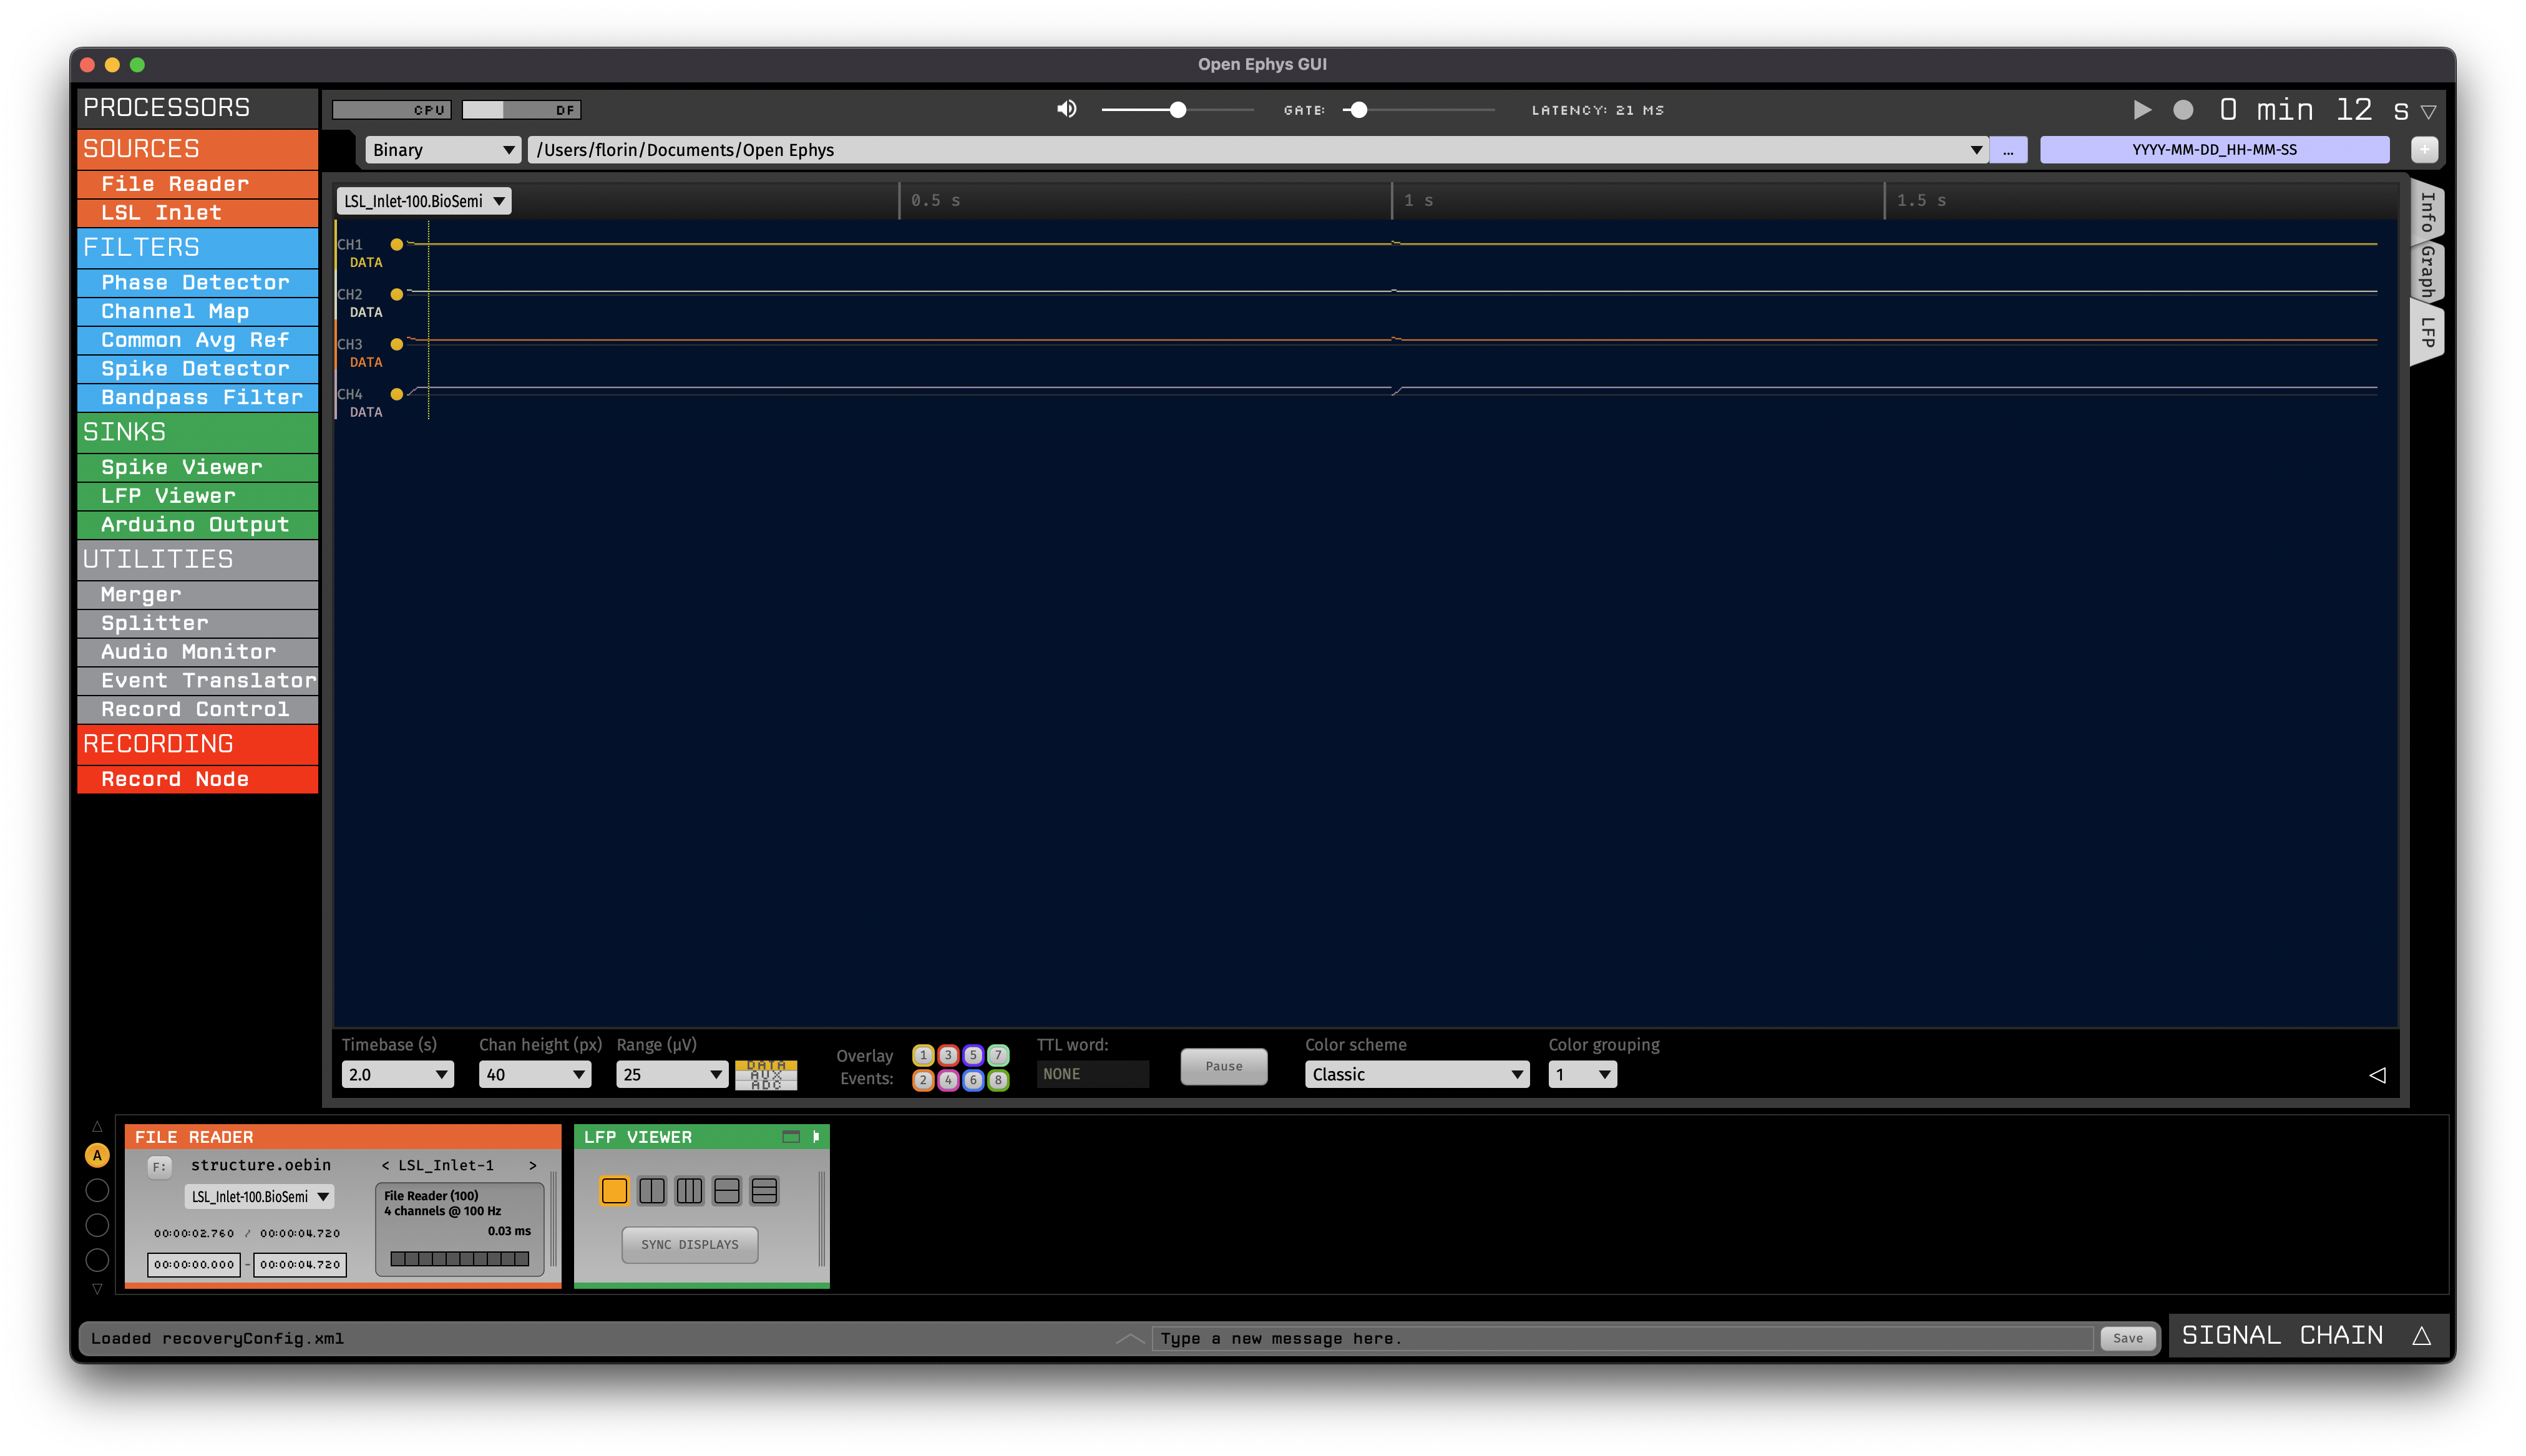
This behaviour is accentuated for more complex signals and they look broken. When the sampling rate is 1kHz or higher I didn't notice the any issues.
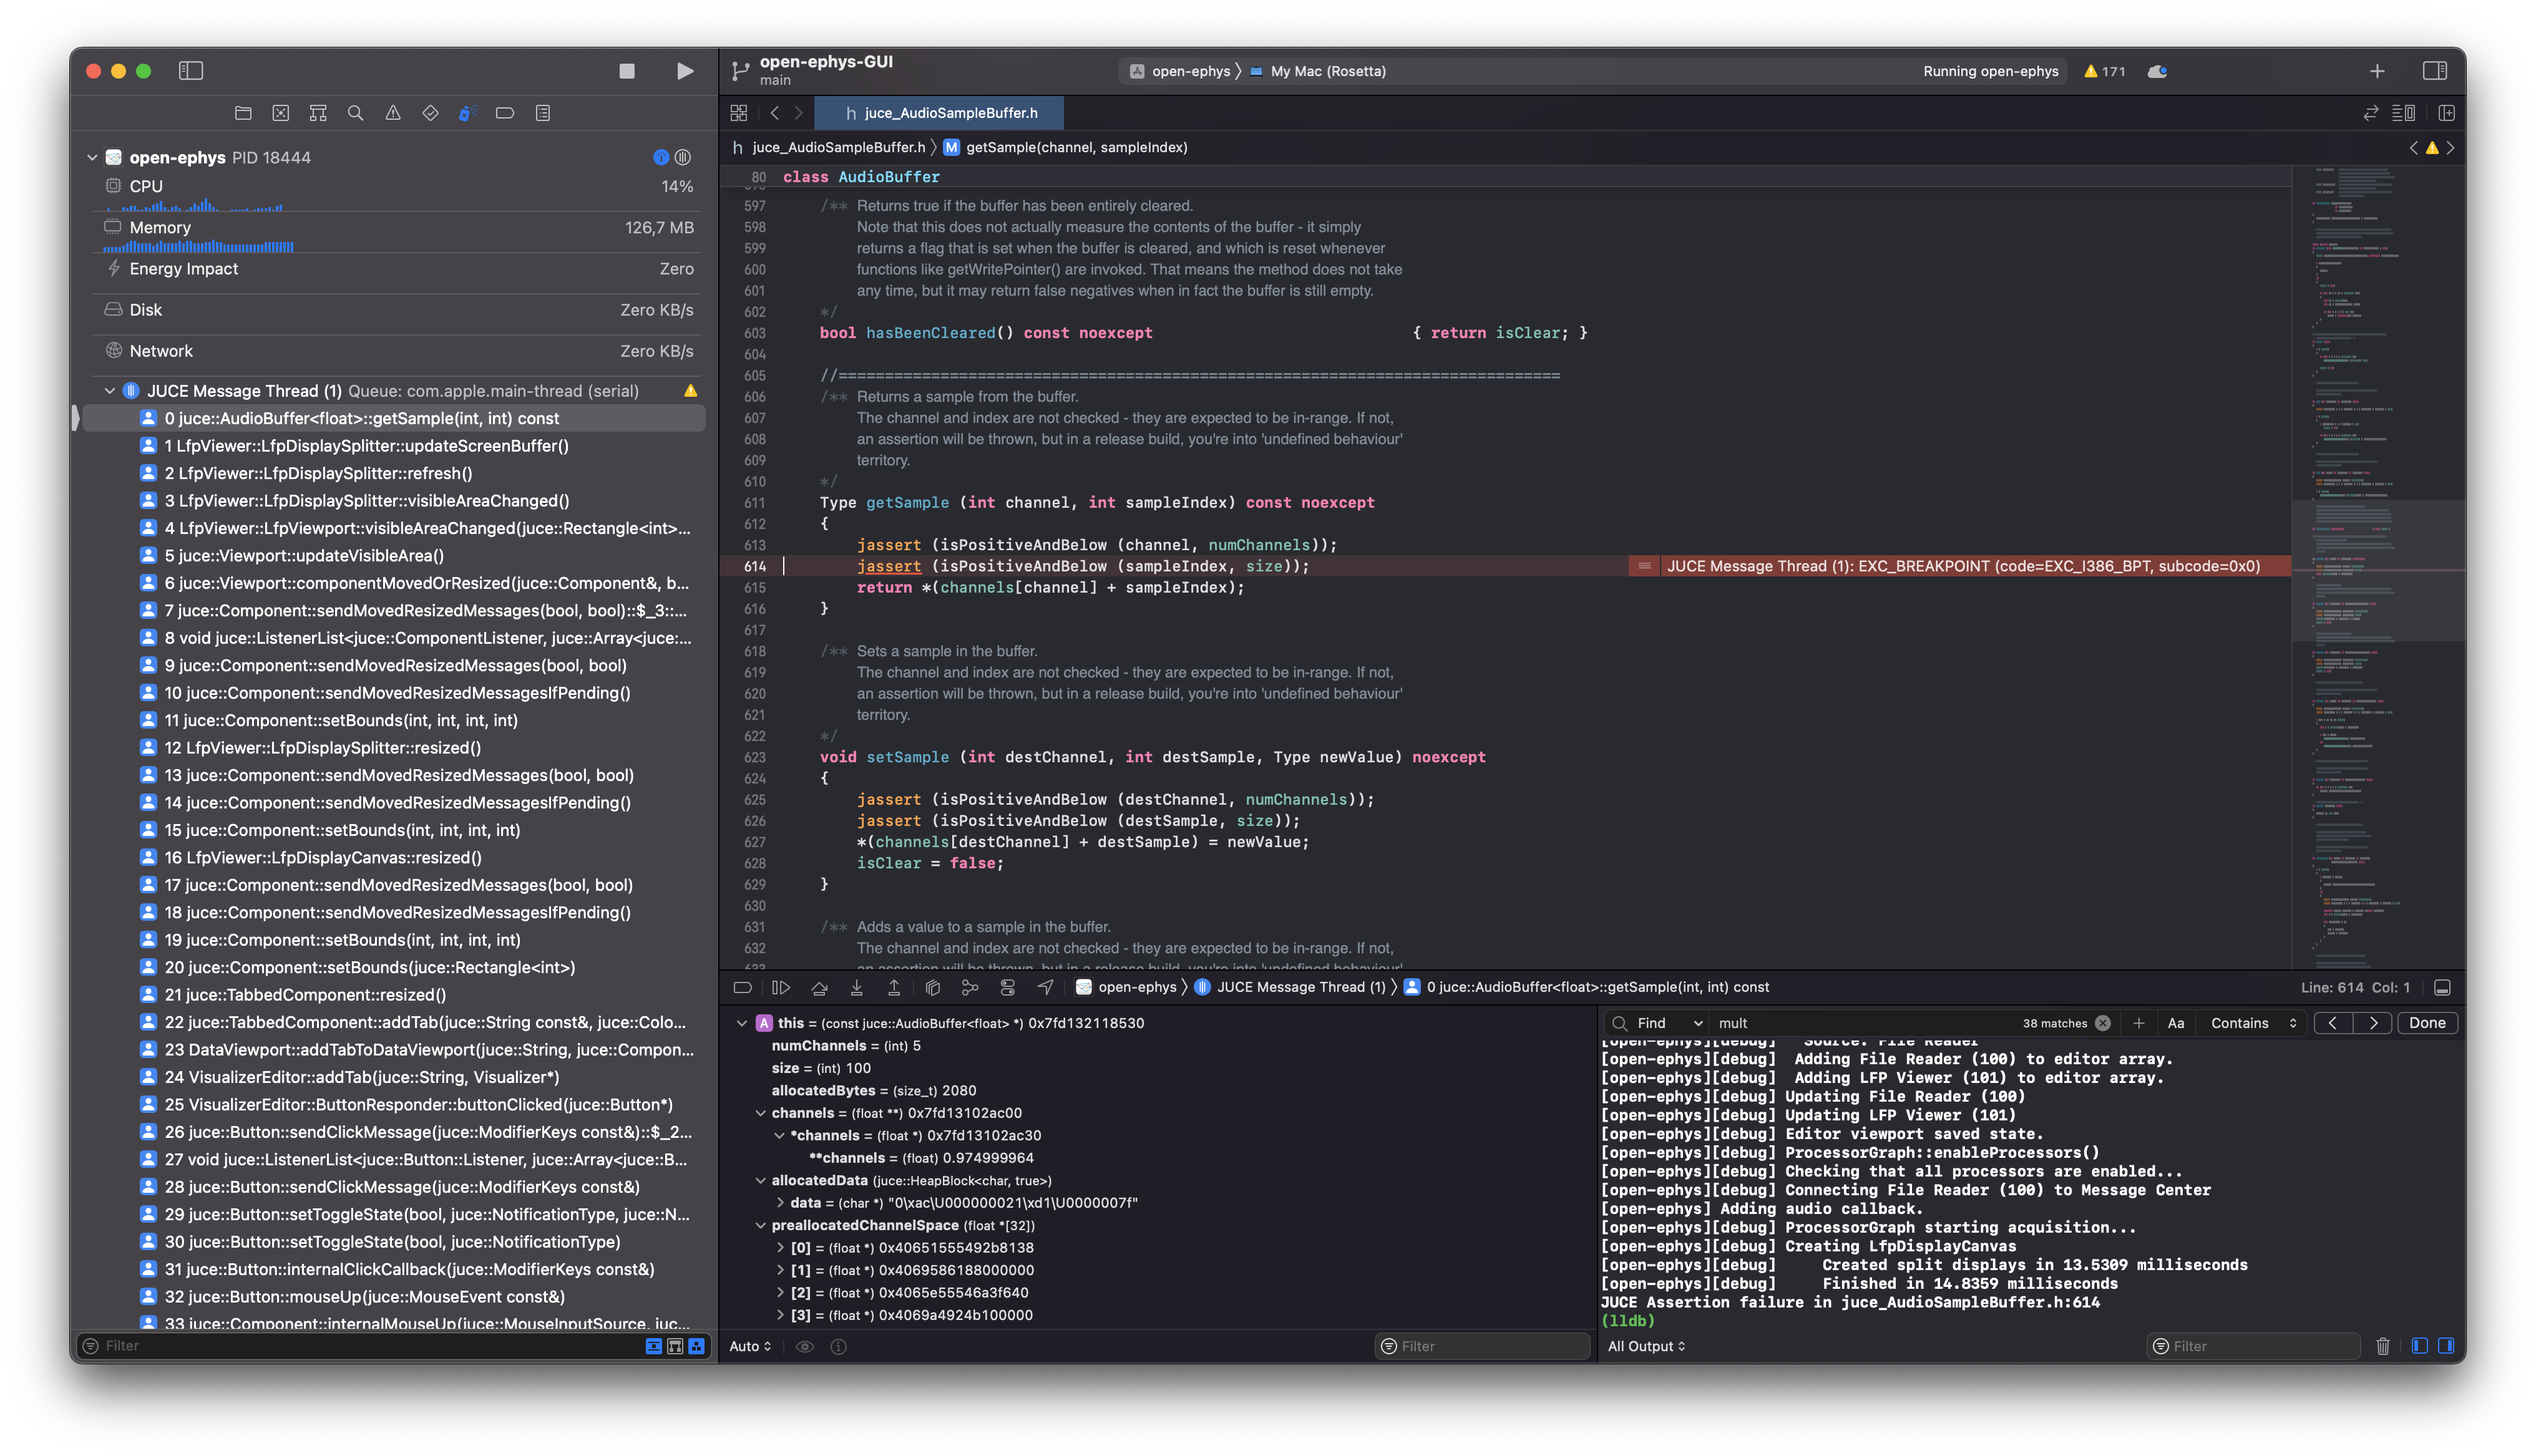
I was trying to investigate if I am doing something wrong and started the GUI with the debugger and noticed some assertions failing in a buffer associated with LFP. Could this be a limitation or a bug with open-ephys?
Hello,


I've recently started working on a plugin for
open-ephysand I noticed a strange behaviour with signals that have a low sampling rate (around 100Hz), specifically there are discontinuities in the waveform.The behaviour can be reproduced with the
File Readerby loading this sample data which contains 472 samples and 4 channels, each sample has a constant value (0.97uV for channel 1, approx. 2 uV for channel 2 and so on). The expectation is to see a continuous line in the LFP plot, but it's often an interrupted line.This behaviour is accentuated for more complex signals and they look broken. When the sampling rate is 1kHz or higher I didn't notice the any issues.
I was trying to investigate if I am doing something wrong and started the GUI with the debugger and noticed some assertions failing in a buffer associated with LFP. Could this be a limitation or a bug with
open-ephys?